(SOLVED) hypothesis
Discipline: Finance
Type of Paper: Question-Answer
Academic Level: Undergrad. (yrs 3-4)
Paper Format: APA
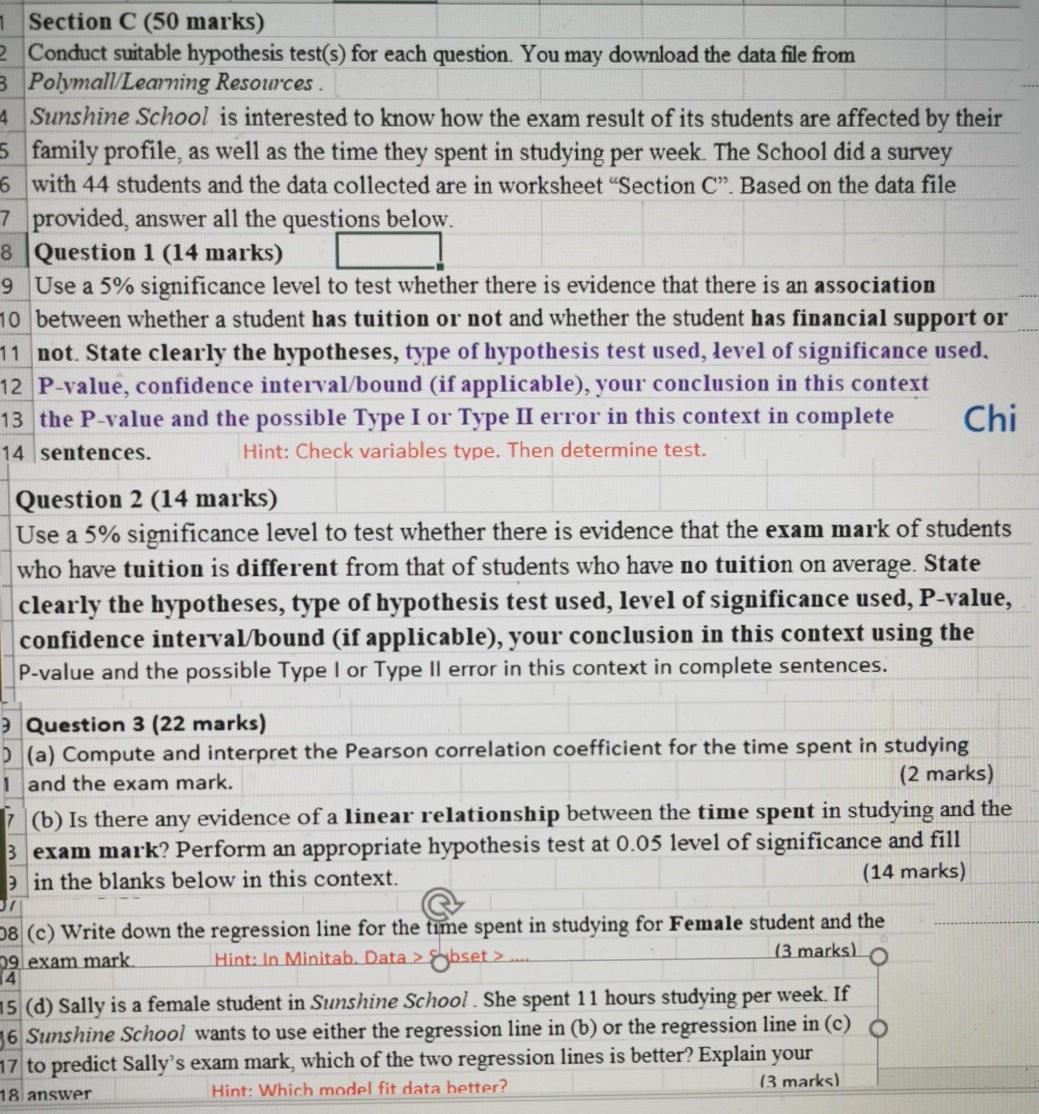
Question
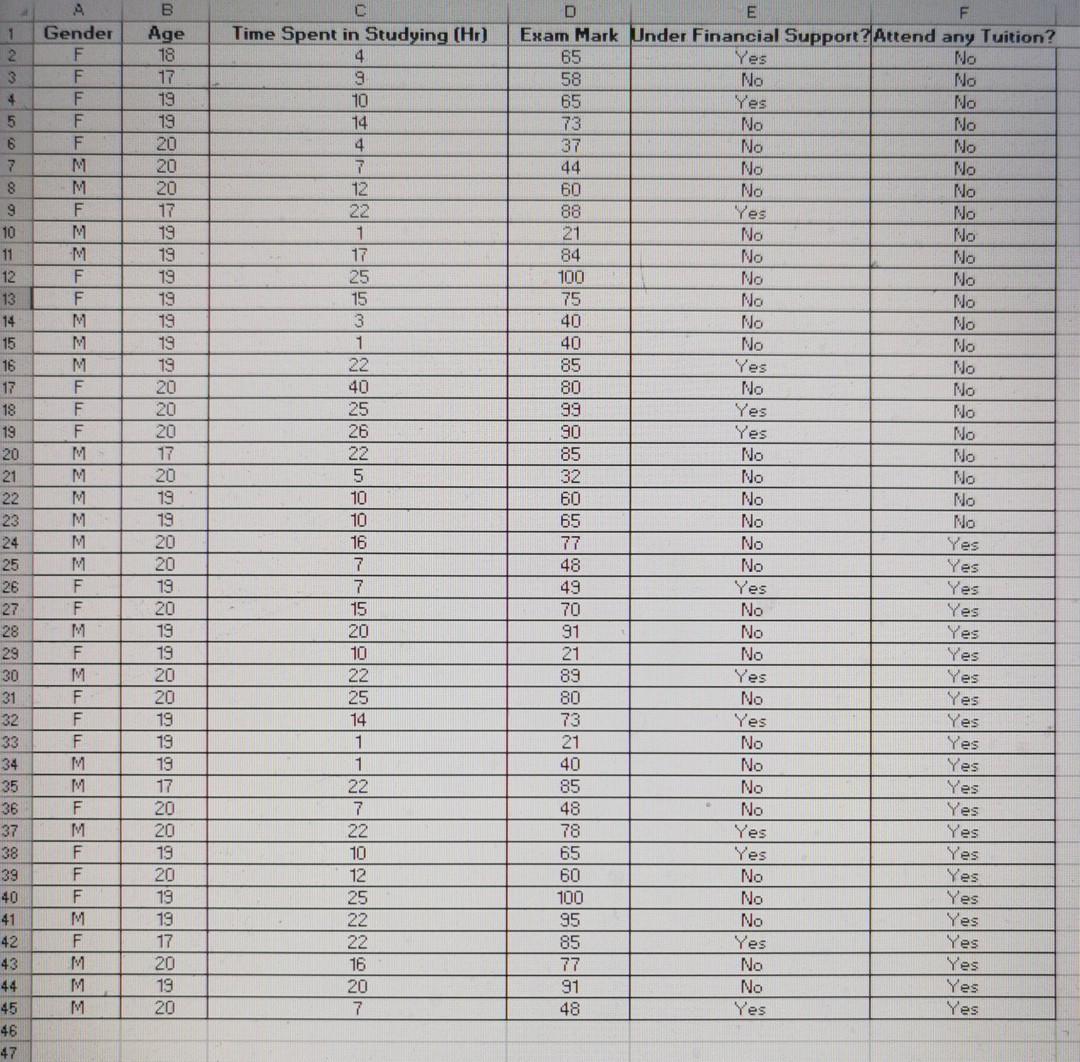
1 2 3 4 5 6 7 8 9 10 11 12 13 14 15 16 17 18 19 20 21 22 23 24 25 26 27
28 29 30 31 32 33 34 35 36 37 38 39 40 41 42 43 44 45 46 47 Gender F F F
F F M M F M M F F M M M F F F M M M M M M F F M F M F F F M M F M F F F
M F M M M B Age 18 17 19 19 20 20 20 17 19 19 19 19 19 19 19 20 20 20
17 20 19 19 20 20 19 20 19 19 20 20 19 19 19 17 20 20 19 20 19 19 17 20
19 20 C Time Spent in Studying (Hr) 4 9 10 14 4 7 12 22 1 17 25 15 3 1
22 40 25 26 22 5 10 10 16 7 7 15 20 10 22 25 14 1 1 22 7 22 10 12 25 22
22 16 20 7 D E F Exam Mark Under Financial Support? Attend any Tuition?
65 Yes No 58 No No 65 Yes No 73 No No 37 No No 44 No No 60 No No 88 Yes
No 21 No No 84 No No 100 No No 75 No No 40 No No 40 No No 85 Yes No 80
No No 99 Yes No 90 Yes No 85 No No 32 No No 60 No No 65 No No 77 No Yes
48 No Yes 49 Yes Yes 70 No Yes 91 No Yes 21 No Yes 89 Yes Yes 80 No Yes
73 Yes Yes 21 No Yes 40 No Yes 85 No Yes 48 No Yes 78 Yes Yes 65 Yes Yes
60 No Yes 100 No Yes 95 No Yes 85 Yes Yes 77 No Yes 91 No Yes 48 Yes
Yes
Expert Answer
Question1: To test whether there is an association between whether student has tution or not and whether the student has financial support or not.
First we need to compute contingency table for this
| Financial support or not\Tuition or not | Yes | No | RowTotal |
| Yes | 7 | 6 | 13 |
| No | 15 | 16 | 31 |
| Column Total | 22 | 22 | 44 |
The hypothesis are
Ho:Tution and financial support are independent
H1::Tution and financial support are not independent.
Steps:1 Compute expected values
Fromula=(Row total first*Column total first)/total
and similarly for otheres
| Expected values | | |
| Financial support or not\Tuition | Yes | No |
| Yes | 6.5 | 6.5 |
| No | 15.5 | 15.5 |
Step2: Compute Test-statistics
| (Observed-Expected)^2/Expected | ||
| Financial support or not\Tuition | Yes | No |
| Yes | 0.038462 | 0.038462 |
| No | 0.016129 | 0.016129 |

The test statsitics follows chi-sqaure distribution with degrees of freedom=(r-1)*(c-1)=(2-1)*(2-1)=1
Chi-sqaure critival value is computed from chi-square table with degrees of freedom 1 and sigificance level 5%
Chi-critical=3.841
Conclusion: Here Chi-statistics value is less than chi-critical value, hence we fail to reject null hypothesis and conclude that Tution and financial support are independent
Question 2:
To test whether the average marks of students who has tution differs significantly from the average marks of students who do not have tuition.
| x1 | 67.77273 |
| x2 | 63 |
| s1 | 22.99054 |
| s2 | 23.08989 |
| n1 | 22 |
| n2 | 22 |
The hypothesis are
 i.e the average marks of students who has tution equals to average marks of students who do not have tuition.
The test-statsitcs of the distribution is given by

The test-statistics follows t-distribution with degrees of freedom

Since we have two tailed test P-value is computed from t-dsitribution table 5% level of significance with degrees of freedom
P-value=0.4958
Conclusion: Since P-value is greater than level of signiifcance, hence we fail to reject null hypothesis and conclude that the average marks of students who has tution equals to average marks of students who do not have tuition.
Question3:
a.) The correlation coefficent between time spent on study and "exam" mark is given by

which implies that there is strong linear relationship between time spent on study and "exam" marks.
b.) The hypothesis are
Ho:P=0 i.e Popuation correlation coefficent between time spent on study and "exam" marks is equal to zero
H1: P is not equal to zero
The test-statsitcs is

The test-statistics follows t-distribution with segrees of freedom n-2=44-2=42
Since we have two tailed test P-value is computed from t-dsitribution table 5% level of significance with degrees of freedom
P-value=0.00001
Conclusion: Here P-value is less than significance level , hence we reject null hypothesis and conclude that there is statistically significance relationship between time spent on study and "exam" marks.
c.) The regression line for females to predict the "exam" marks given the time psent on study
"Exam" marks=a+b*Time spent on study+e
Using excel data analysis tool pack we have
| Regression Statistics | | | | | | | | |
| Multiple R | 0.615111 | | | | | | | |
| R Square | 0.378362 | | | | | | | |
| Adjusted R Square | 0.34728 | | | | | | | |
| Standard Error | 19.09544 | | | | | | | |
| Observations | 22 | | | | | | | |
| | | | | | | | | |
| ANOVA | | | | | | | | |
| | df | SS | MS | F | Significance F | | | |
| Regression | 1 | 4438.737 | 4438.737 | 12.17307 | 0.002313 | | | |
| Residual | 20 | 7292.717 | 364.6359 | | | | | |
| Total | 21 | 11731.45 | | | | | | |
| | | | | | | | | |
| | Coefficients | Standard Error | t Stat | P-value | Lower 95% | Upper 95% | Lower 95.0% | Upper 95.0% |
| Intercept | 41.94249 | 7.895524 | 5.312186 | 3.37E-05 | 25.47272 | 58.41227 | 25.47272 | 58.41227 |
| Time Spent in Studying (Hr) | 1.518319 | 0.435174 | 3.488992 | 0.002313 | 0.610562 | 2.426076 | 0.610562 | 2.426076 |
Hence the estimated regression line is
"Exam" marks=41.94+1.51*Time spent on study+e
d.) Since in queation, We have been asked to fit lieanr regression in sub part c only so we have only one regression line here as
"Exam" marks=41.94+1.51*Time spent on study+e
The predicted "exam" makrs of sally are
"Exam" marks=41.94+1.51*11=58.55